
Dashboards & Reporting
Your real numbers, in one place, updated automatically.
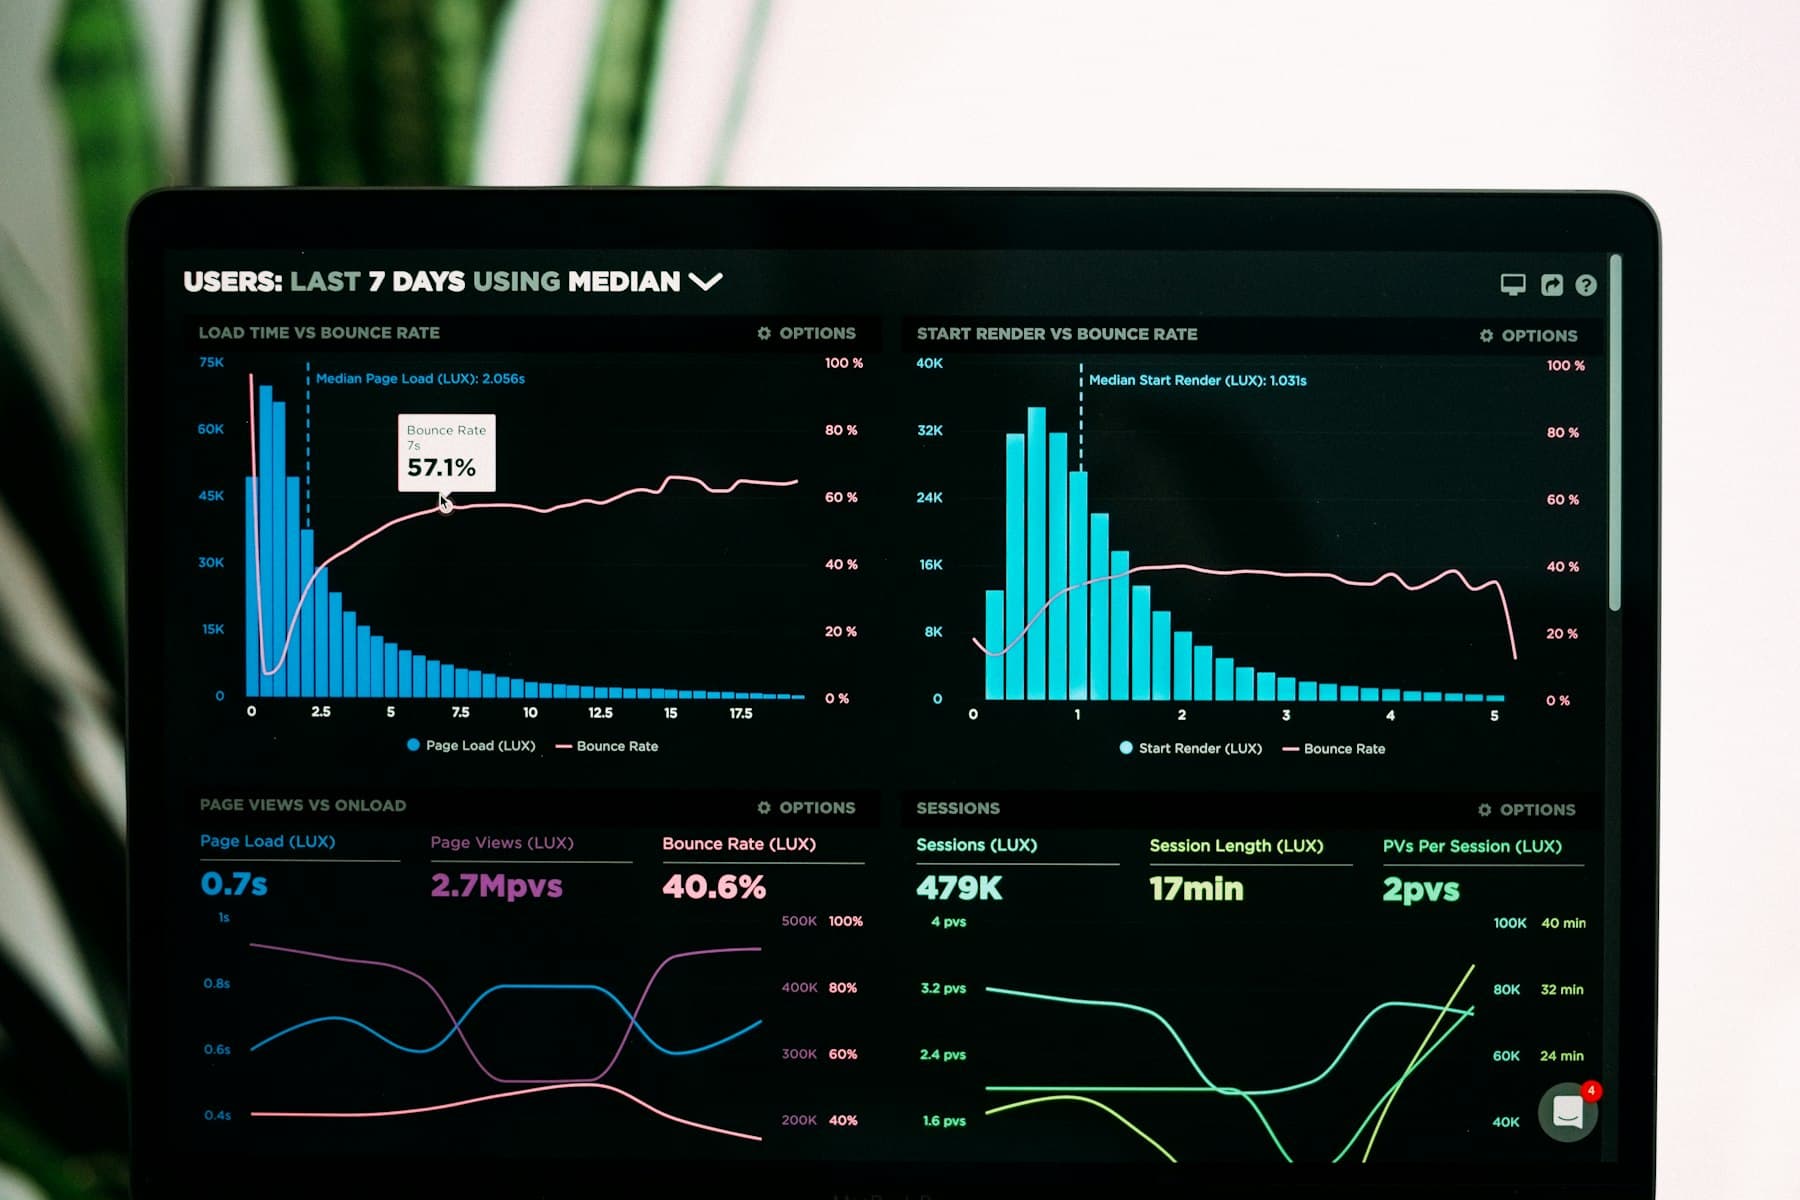
Most small business owners can't answer "how are we doing this month" without logging into three different tools and doing math by hand. A live dashboard pulls the numbers that actually matter — revenue, jobs, conversion, whatever you track — into one clear picture that updates itself.
What's included
Standalone BI/reporting tools often run $70–$200/month on their own.
A dashboard built into your system comes with it — one less subscription, tailored to what you track.
Common questions
Can it pull data from tools we already use, like our POS or booking system?
In most cases, yes — we connect to the systems you already run rather than asking you to re-enter data.
We're not a 'numbers' business — is this overkill?
Not if you've ever had to guess how a month went. Most owners just want 3–5 numbers front and center, which is usually all this needs to show.
Let's talk about your dashboards.
Free consult, no obligation — tell us what you're working with and we'll tell you what it would take.
Book a free consult